Problem solving interview
The essential skills required for efficient leadership are effective communication, team work and problem solving
Today’s business environment is evolving continuously and companies have to cater to the needs of customers. Complex problem solving is identified as one of the top skills which have huge demand in the future. Problem solving consists of identifying and solving the problem by analyzing it thoroughly.
By asking “Why?” five times, the final answer should get at the potential root cause of the problem.
What is STAR method in interview?
In Interviews sometimes questions based on problem solving situations are usually asked the best way to answer such questions are STAR method. In STAR ( Situation ,Task, Action and Result) candidates can explain about the difficult situations they faced earlier in their career, What was their allocated Task and actions and how they solved the situation.
Steps in Problem solving
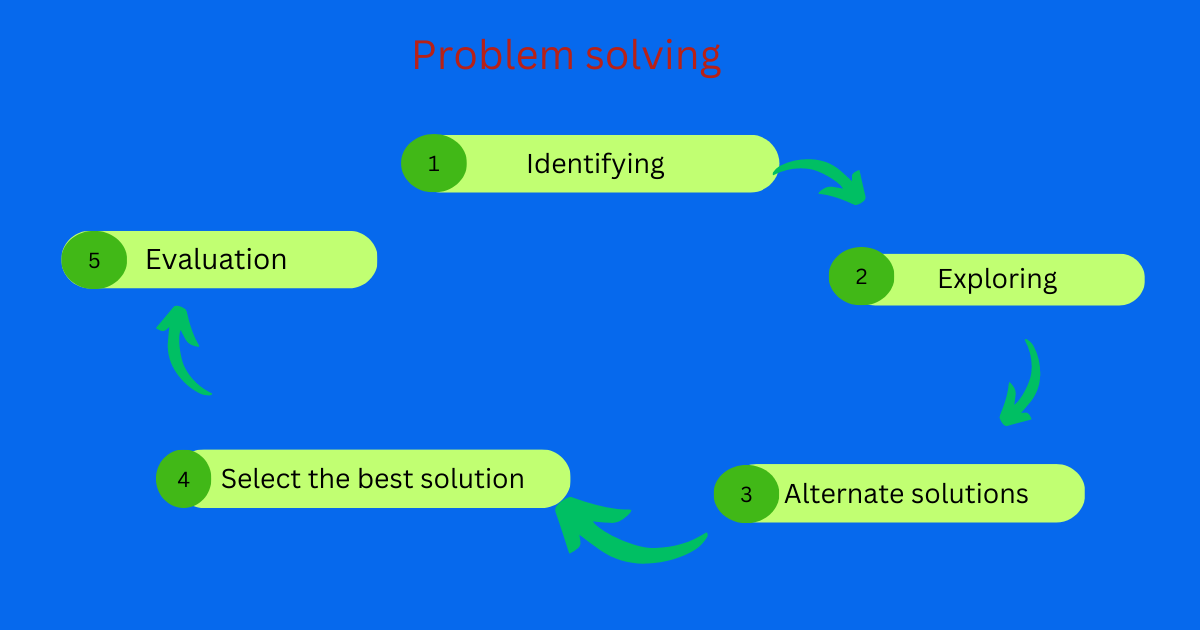
Steps in Problem solving are Identify the problem, explore the root causes of the problem, find alternate solutions, find the best solution and implement the solution and do the evaluation.
-
Identify the Problem : Identify the problem and collect the information about that problem
-
Explore deeply the causes: After identifying the problem, Technique such as brain storming, 5 ‘w’ and 1 ‘H’ are used to analyze the root cause of the problem. Questions in the format What? Where? When? Why?Who and How? are used.
- Who is the cause of the problem?
- What are the consequences of the problem?
- Why did it happen?
- why it is important ?
- Where the problem is occurs?
- Which resources are involved?
- How the problem occurs?
After asking number of questions, and brain storming alternate solutions are developed
-
Alternate solutions
Many alternative solutions to the problem should be generated before final evaluation.
-
Select the best solution
Consider the positive and negative effects of each alternative and select the best alternative
-
Implement and evaluate
Implement the selected solution and get all the feedback and make a thorough study about it
Problem solving tricks
Statistical problem solving methods are widely used in all areas of Business decision making.
-
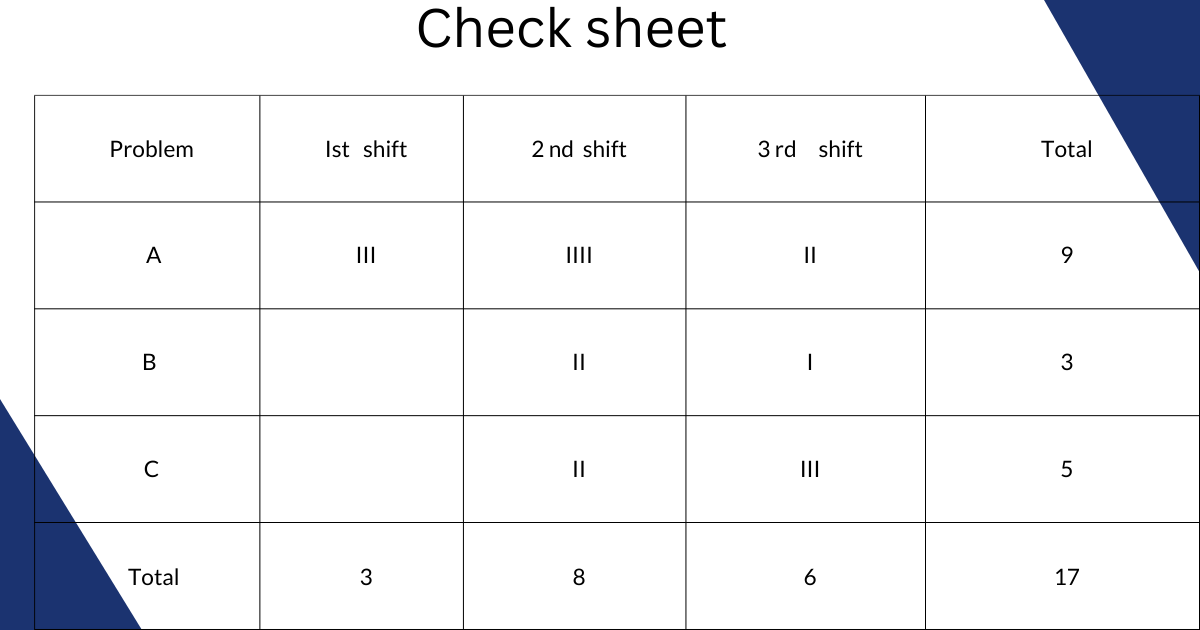
Check sheet
check sheet is a structured, prepared form for collecting and analyzing data
- Design the form.
- Each time the targeted event or problem occurs, record data on the check sheet, simply by putting tally marks
A check sheet for finding out defects in a manufacturing unit .Let us denote the defects as A, B, C
-
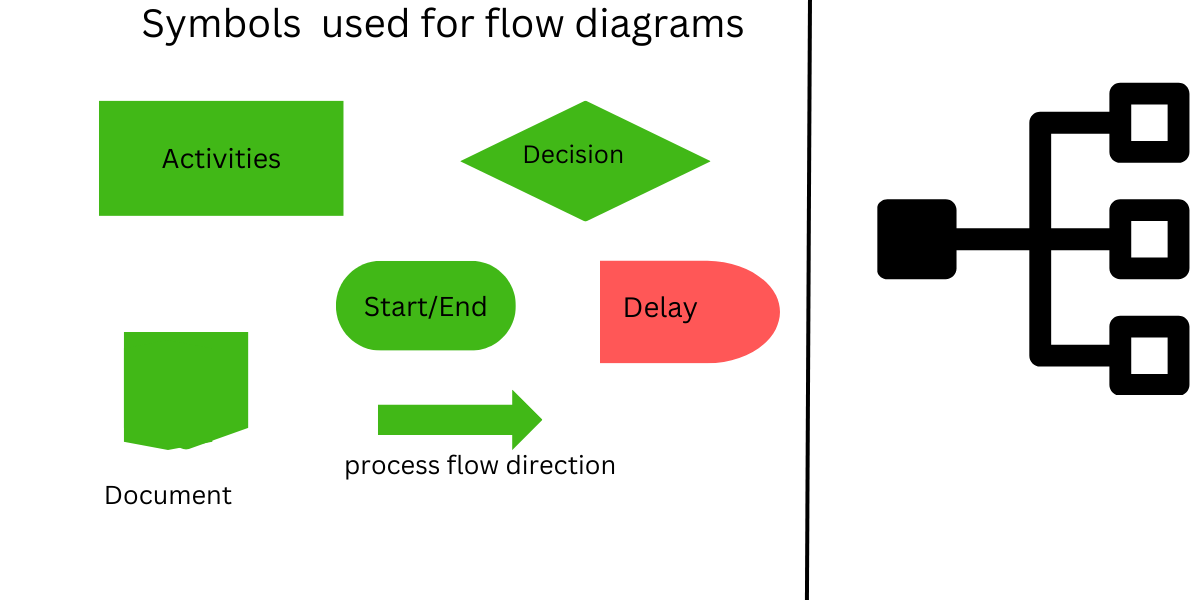
Process Flow diagram
Process flow diagrams show the flow of product or service as it moves through different processing stages. It shows sequence of steps. It consists of standard symbols
- Draw the flow diagram
- Identify the potential trouble spots and perform control activities
- Improvement of process can be achieved by changing ,reducing or combining steps
Manufacturing process flow diagram shows the various stages namely raw material sourcing, production, quality control, and packaging.
Application of Process flow diagram can be extended to a wide variety of sublects
-
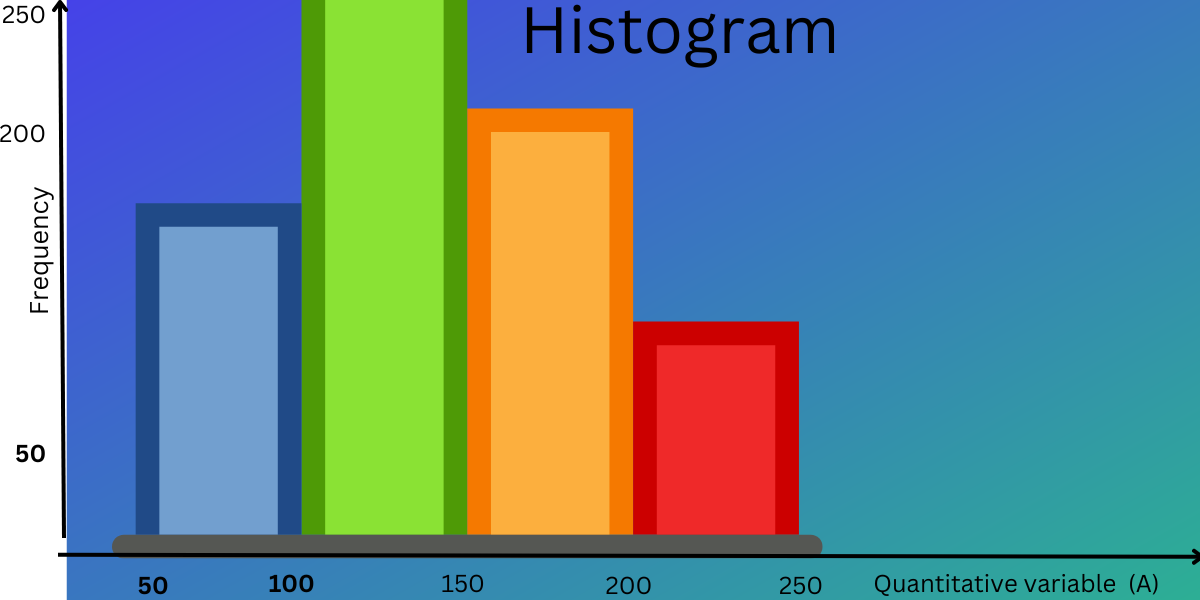
Histogram
Histogram is used to visualize statistical distribution of variable .Large number of data can be summarized using histogram
X-axis of histogram represents Response variable in which Range of the data is divided into class interval or equal-sized bins
Y-axis of histogram consists of Rectangles which represents counts (frequency) of each bin (problem)
Histogram represents variation in the process and is used to visualize statistical distribution of variable (ie. normal, exponential) . The statistical distribution of the variable can be identified by analyzing the shape of histogram. For example, a symmetric bell-shaped histogram suggests a normal distribution, while a skewed histogram suggests that the data is not normally distributed. Outliers and clusters in the data can also be identified in histogram.
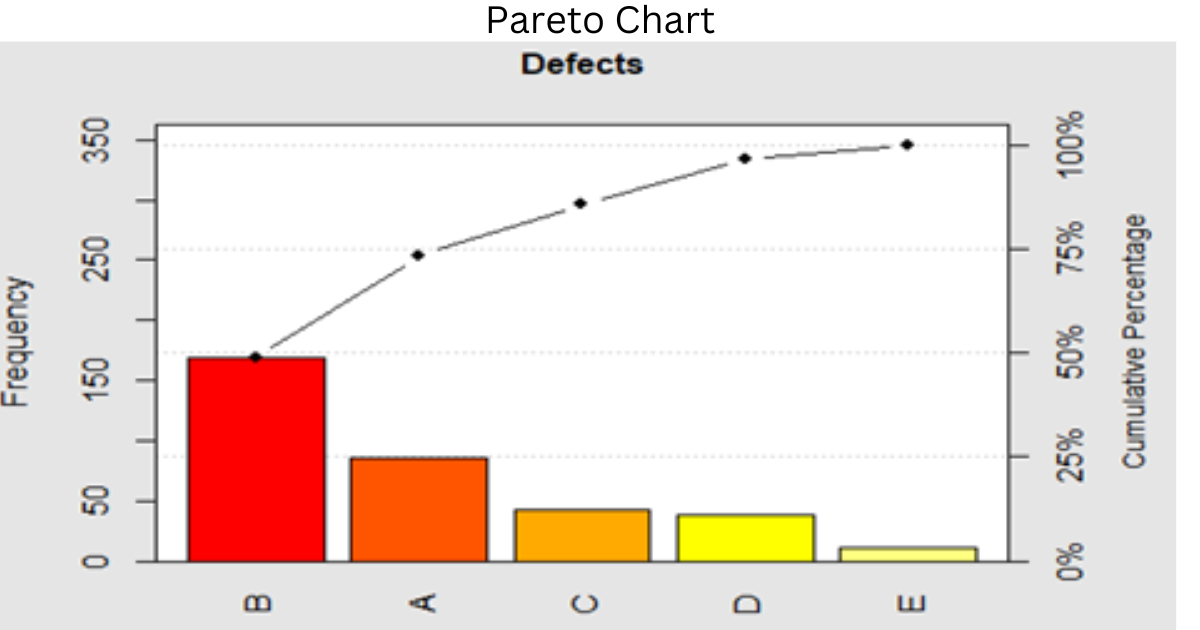
4.Pareto chart
To analyze the frequency of problems or causes in a process and to focus on the most significant by ranking them in descending order of importance.
20 % of vital few causes are responsible for 80% of all internal failures in manufacturing problems. Identifying these “vital few” and ignoring the “trivial many” can be performed by using Pareto charts
-
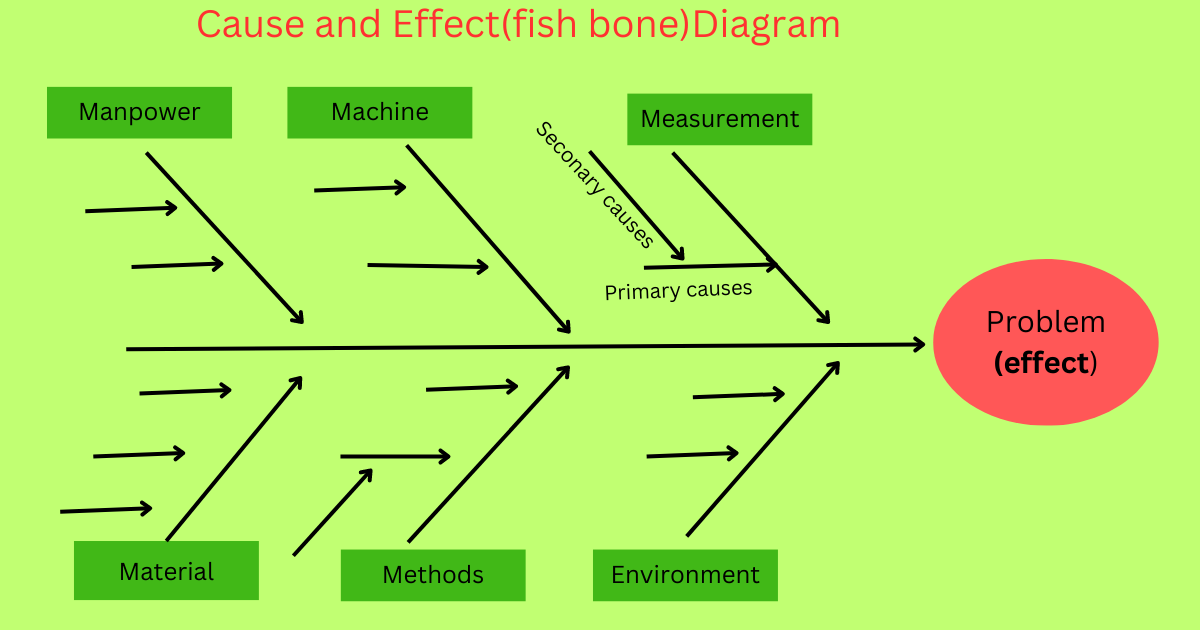
Fish bone diagrams (Cause and effect diagrams)
Brainstorm the major categories of causes of the problem
Ask “Why does this happen?” As each idea is given, mark it a diagram
Name the main problem or event. This usually goes at the head of the “fish” in your diagram.
Make categories for causes and create the “bone structure” of your fish.
Common categories include:
Methods , Machines , Manpower , Materials ,Measurement ,Environment
The major cause categories are written in the boxes on the left side of Cause and Effect Diagram. Summarize the major causes under the categories.
5.Scatter diagram
Tool to determine cause and effect relationship between two quantitative variables .The independent variable is plotted along X-axis and dependent variable is plotted along Y-axis.
By using this diagram it is possible to find the relationship between variables
Two variables under study are plotted along x and y axis. If there is positive relationship between variables, the points tends to form straight line slopes upward from the origin. If there is no relationship then the points scatter randomly.